Blogs
Practical Insights & Latest Happenings
Don’t miss out on the latest trends and info on SEO, search engines, social media, and more.

Powerful in-content links that…

White-Hat, Niche Relevant, Editor..

White-Hat, Niche Relevant, Editor..

White-Hat, Niche Relevant, Editor..

White-Hat, Niche Relevant, Editor..
White-Hat, Niche Relevant, Editor..

White-Hat, Niche Relevant, Editor..

White-Hat, Niche Relevant, Editor..

White-Hat, Niche Relevant, Editor..
January 22, 2024
mothasim
Since visual content is the future, it’s natural that your SEO strategy should also involve infographic link building for the best results.
But what exactly is Infographic link building, what it contains, and how to leverage its benefits?
This is what this guide is all about where you will learn everything about how to build links with infographics and level up your SEO.
Infographics are a visual way to present any sort of information in an easily understandable way. Visual content like infographics is 30% more likely to be read by the audience than any text articles with a 40% chance of being shared more on social media.
The information presented could be any data, statistics, or just general facts about anything. The idea is to present it visually in a way that makes the most sense. There are no fixed rules on how it should be presented and much creativity is involved.
Infographic link-building is the strategy of creating eye-catching infographics to attract other sites to create backlinks for you.
For this strategy to be successful, the infographic should provide value to the viewer. Listing off random data or facts will not do you much justice. Usually, the information presented has an interesting link between them that captures the attention of anyone who glances at it.
Many benefits are awaiting you if you implement infographic link-building. Some of them are:
Infographics are normally more shared around than other text-based articles. More shares will mean your search rankings will go higher than normal and let Google know you are a trustworthy website.
Due to more shares, they will appear on more websites and social media, which will create more backlinks to your website. This will give you more visitors, and due to the nature of infographics, they are likely to stay and check it out.
As a result, there will be more retention of visitors to your website which will increase the quality of engagement.
Link building itself can be an expensive task, especially paired up with content creation. However, infographics have fairly reasonable costs and have the potential to bring in more backlinks than text posts.
They usually have a higher return on investment (ROI) giving a cost-effective method of backlink creation.
Infographics help to position yourself as an authority in the industry. As a result, your brand awareness will increase increasing a visitor’s trust in your website.
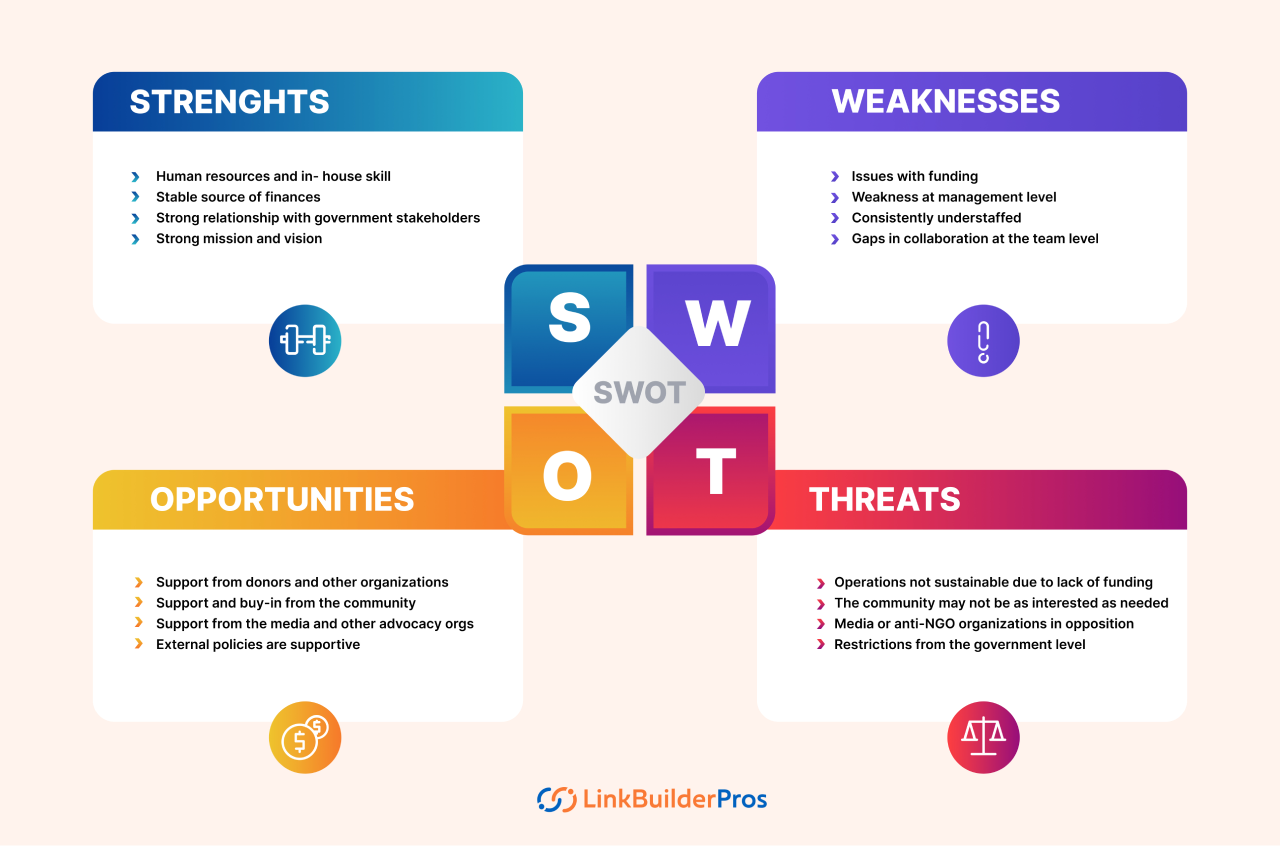
There are a few types of infographics you can try creating. Some key types along with examples are given ahead.
These types of infographics are made to showcase an overview of a topic to an audience who may not be too familiar with the subject. They are meant to summarize a broad topic usually to a general audience.
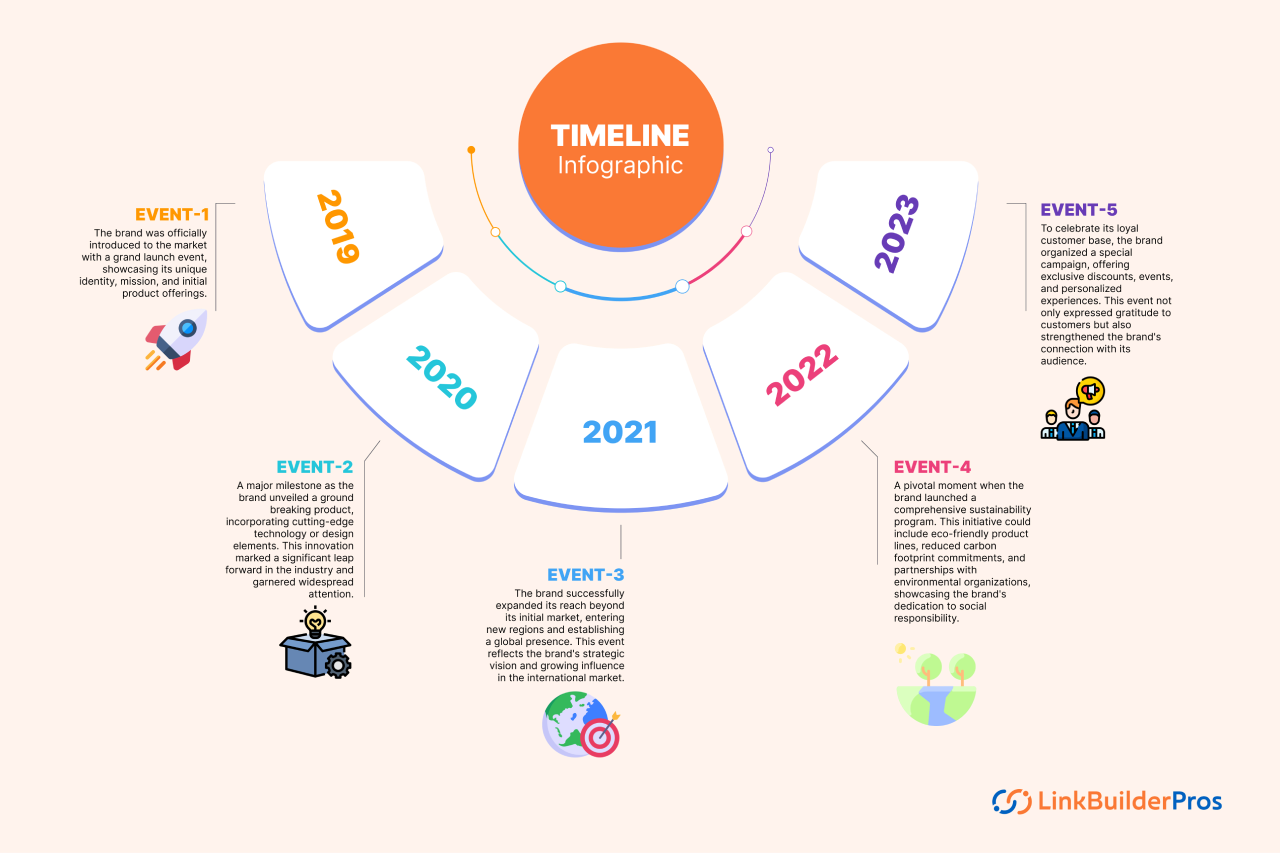
This infographic is used to show a sequence of events, usually in chronological order to show a history of activities of anything. This can be used to show historical events or the growth of any corporation.
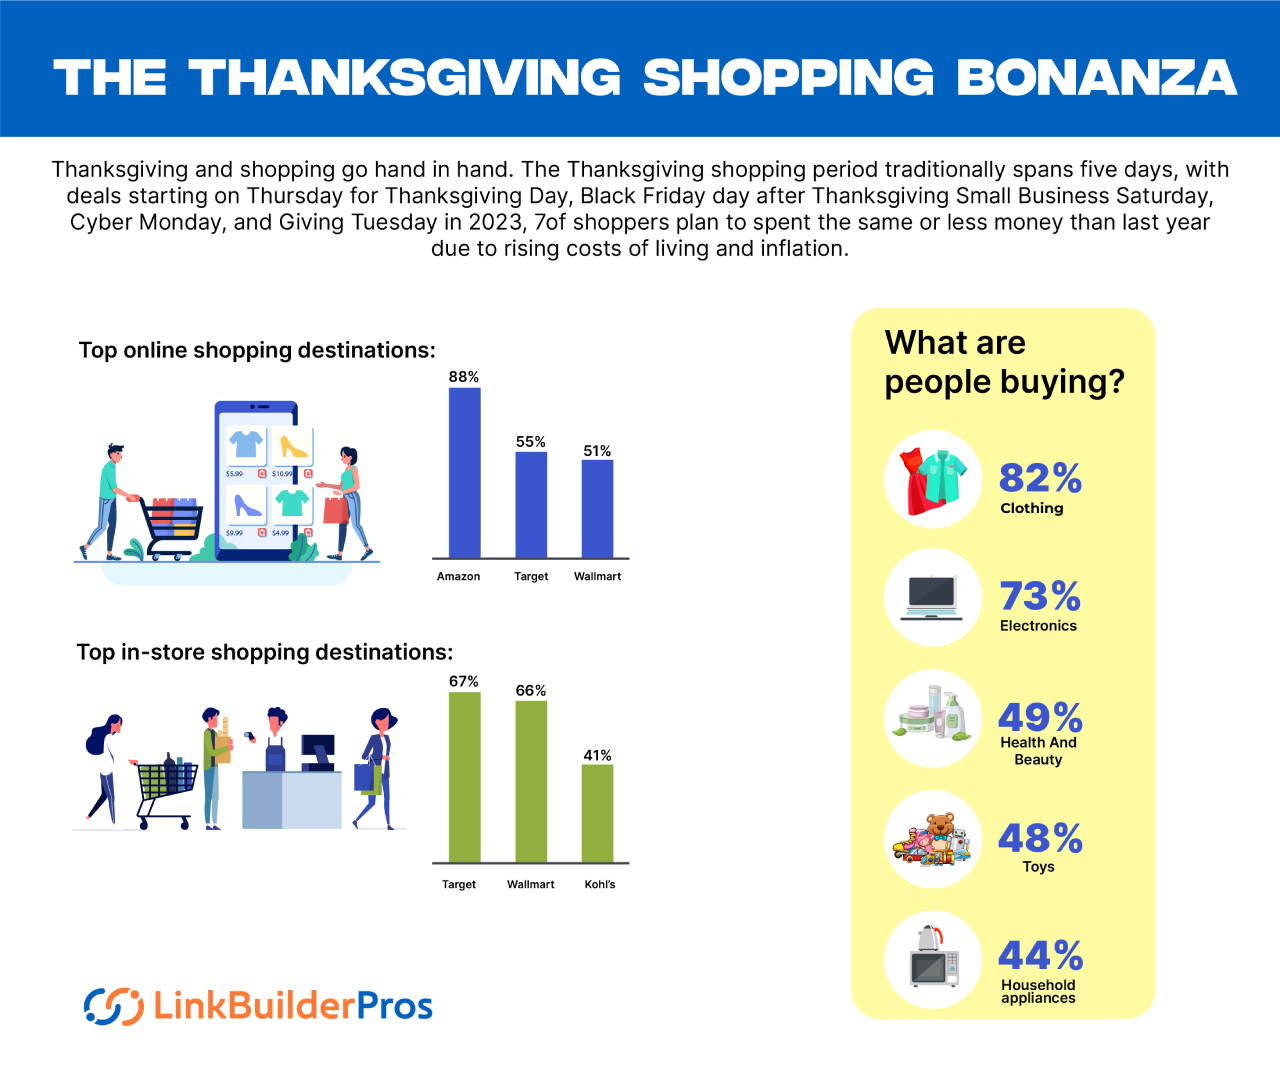
Statistical infographics take statistics or data and usually present it with some context or situation to highlight a situation or prove a point.
Raw statistics do not tell a story by themselves and do not give the audience much to think about when presented. In a simple presentation, any viewer will be able to understand the message of it.
These infographics usually contain charts, graphs, and other types of visual data.
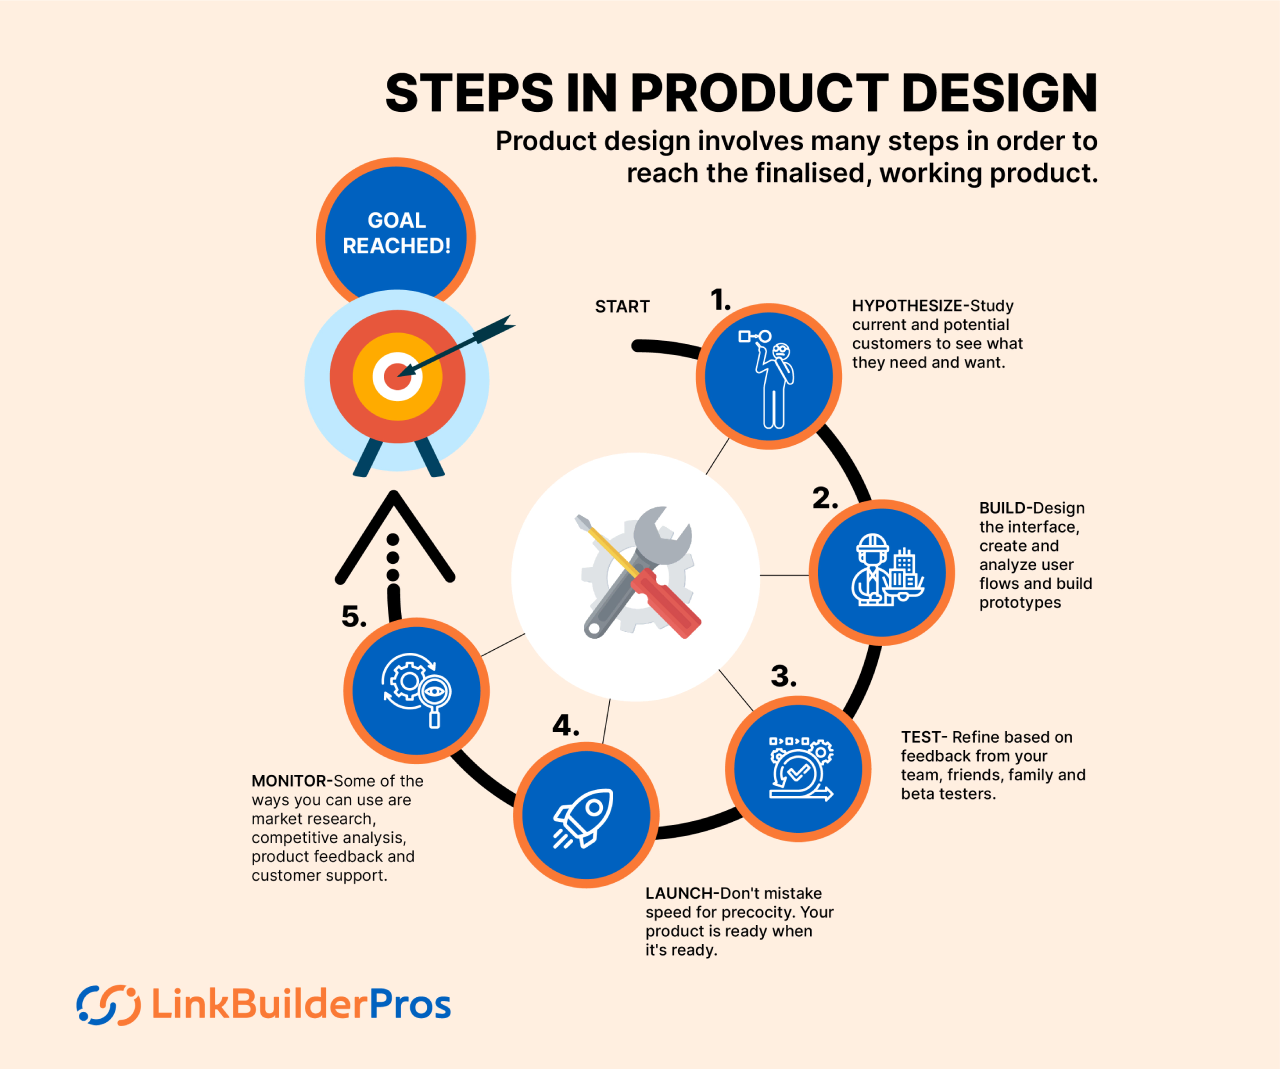
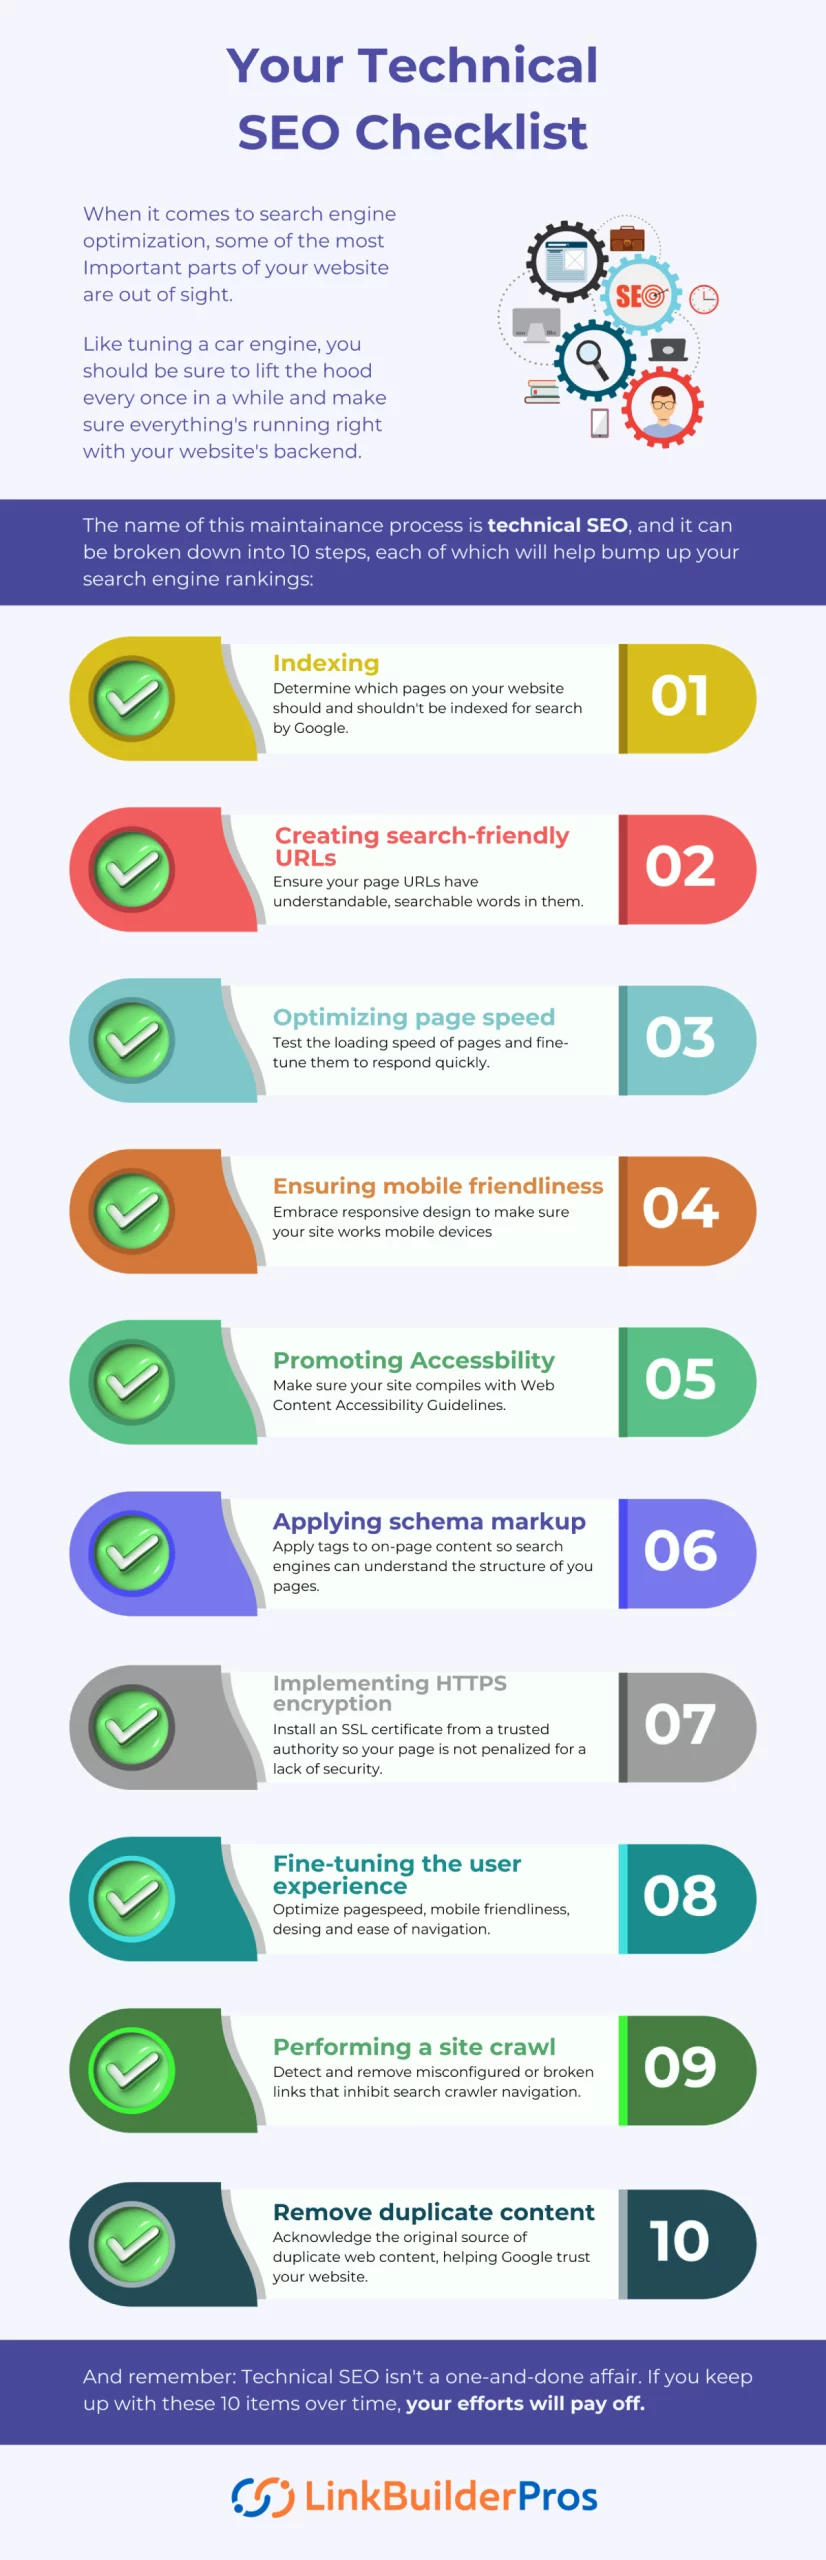
This infographic aims to show the steps of any process that a viewer may want to learn. They use flowcharts, pathways, and diagrams to visually demonstrate the sequence of activities of any complex task.
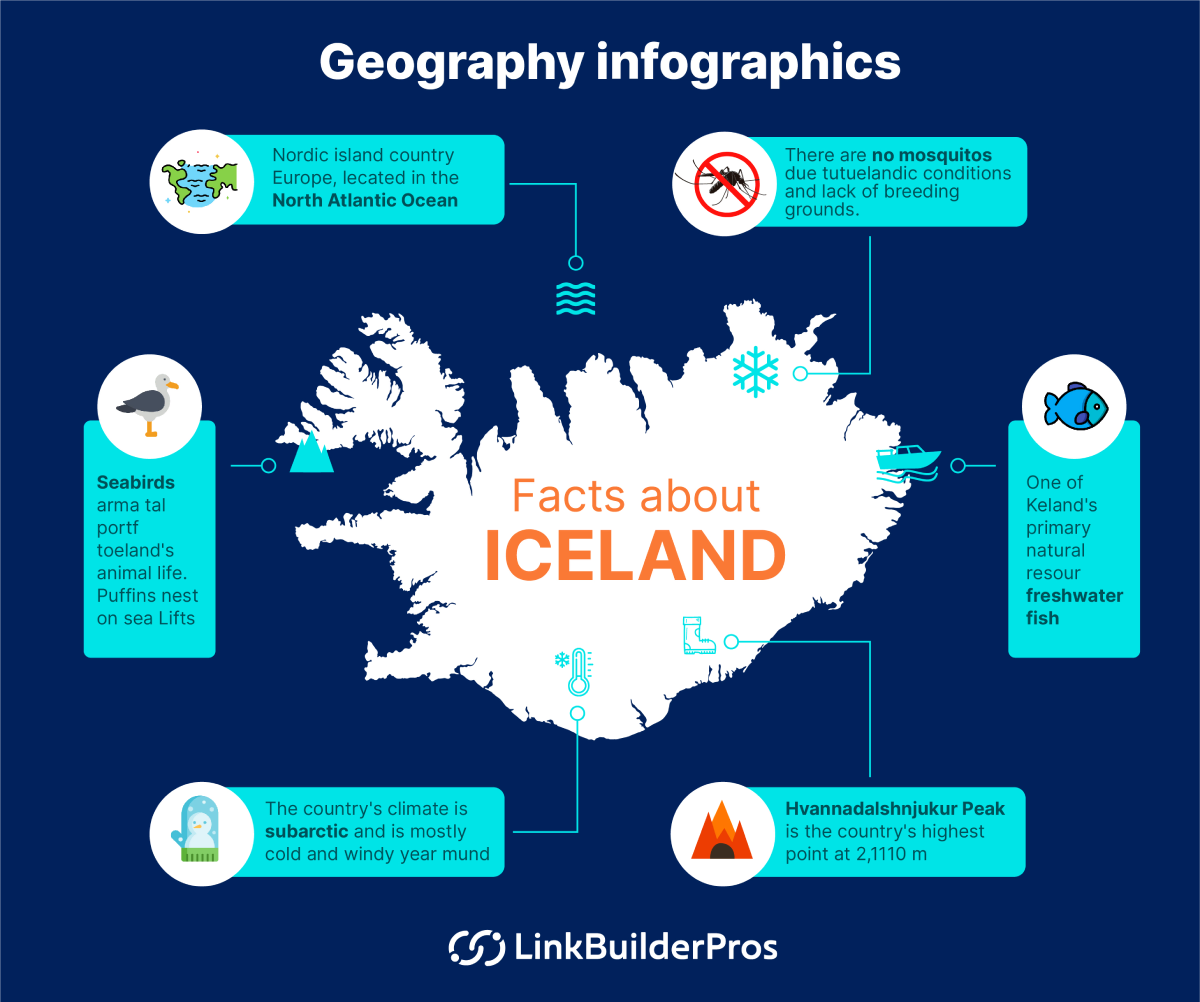
This infographic uses the visual map of any location to show interesting information surrounding it. The facts presented here are mostly centered around the specific place or area depicted on the map. These are usually created to showcase interesting facts about a country or show off important places for tourists.
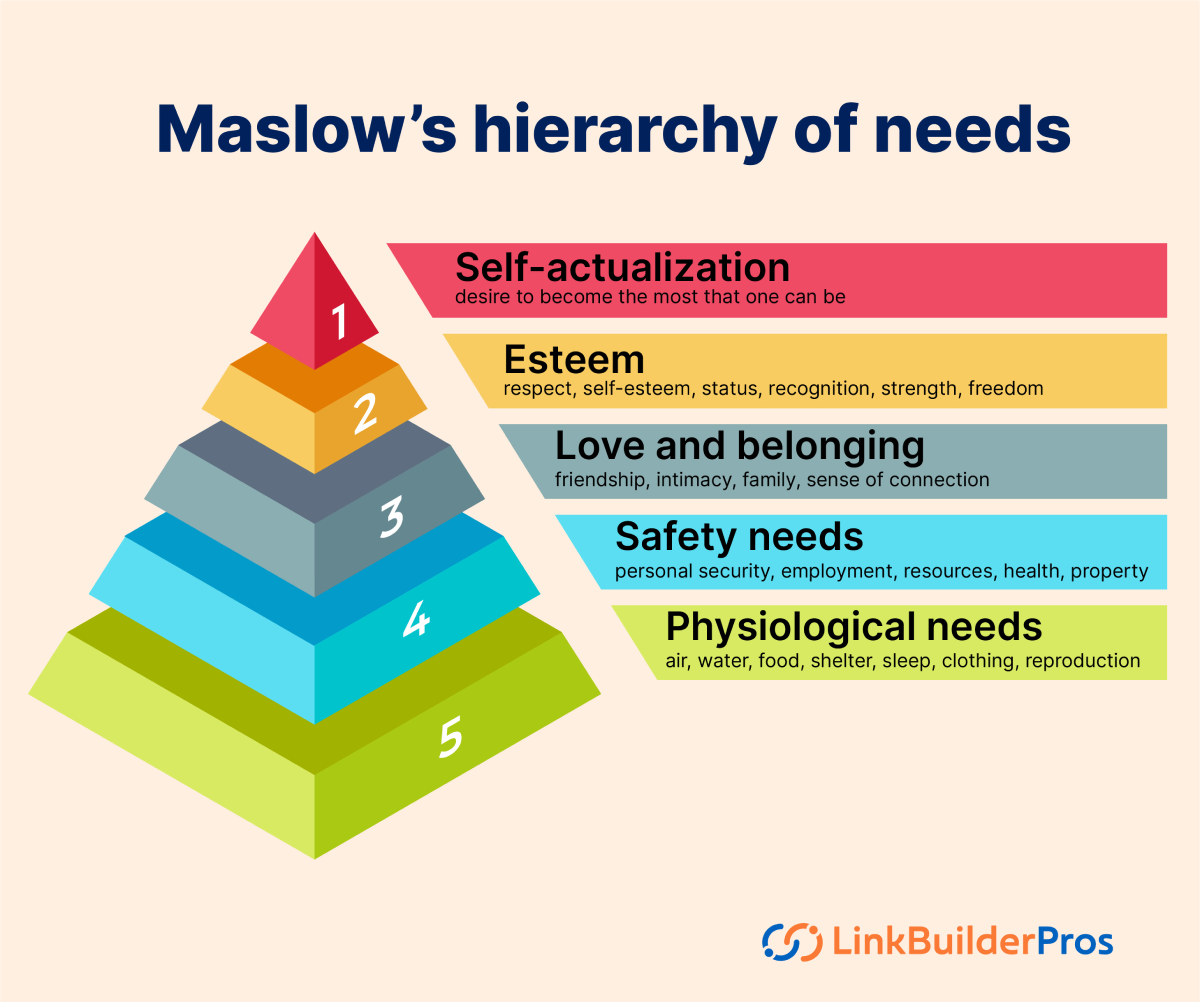
This is a top-to-down display arrangement meant to show the importance of the elements according to a hierarchy (top elements are more important than bottom ones). This can be used to show company leadership structure, processes, or relationships.
The renowned Maslow’s hierarchy of needs is an example of this.
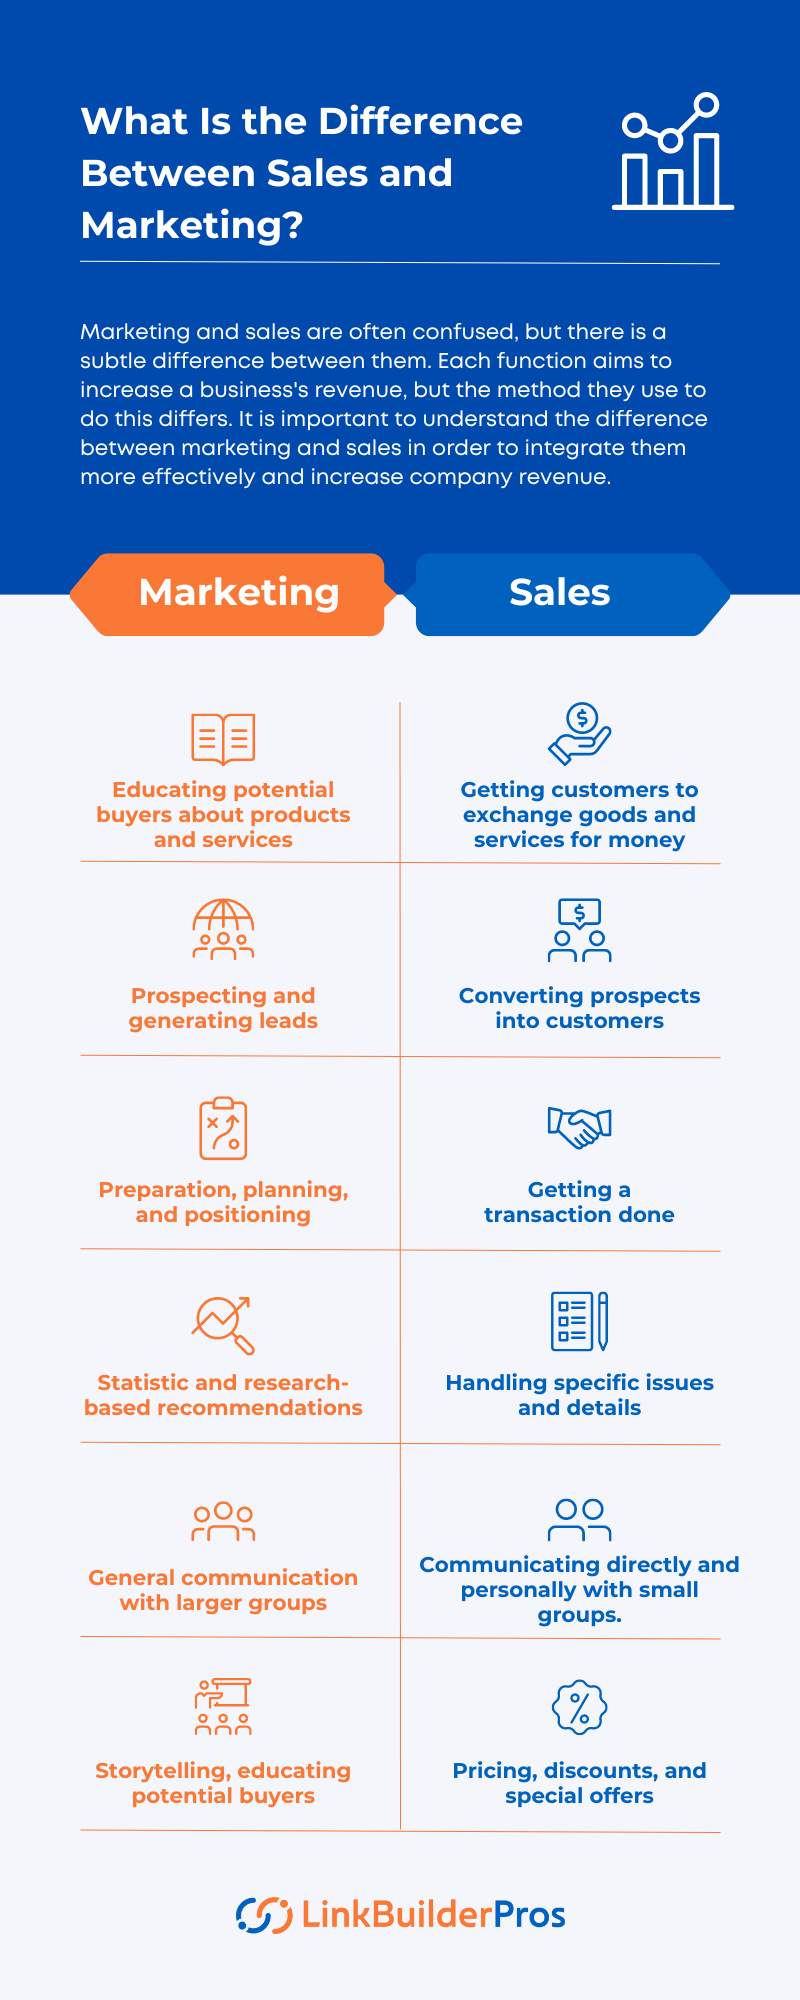
Comparison infographics are used to compare two or more things based on various aspects. Usually, they showcase unique properties between similar things or point out pros and cons.
They include graphs or side-by-side comparisons to present differences to viewers.
List infographics are the most commonly created types. They usually make a list of the topic and add some visual aids to help present the information in a very simple and easy-to-follow manner.
If you want your infographic to be shared around and bring you backlinks for SEO, you will need to make it compelling and well-designed. Here are some steps to help you create your own.
You can choose to create any type of infographic you want based on your niche. However, keep in mind that you will be investing time and money into making it so it would be better to find a topic popular in your niche and understand popular design choices. You will need to research to find that out which will help you understand what kinds of designs are popular and make your job easier.
So how do you find such a topic? You can use one of the following resources.
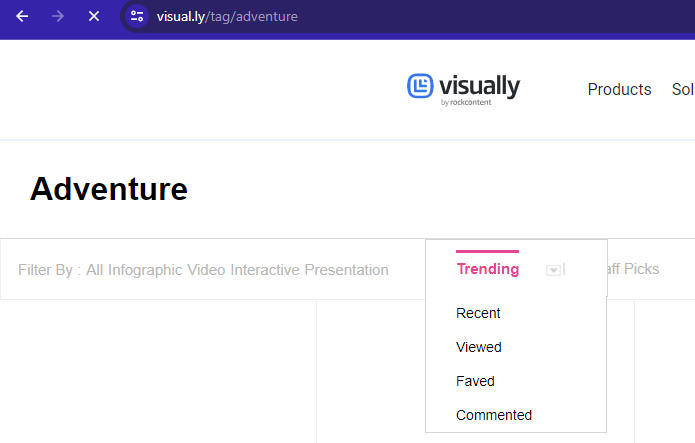
Visit Visual.ly to look up your niche and filter the search to “faved” to get an idea of the most “liked and shared” infographics. You will get an idea of what to work on and what types of designs are popular after you observe a few of the top ones. Save some of them if you feel like you will need them for reference.
Visit Pinterest and look up infographics of your niche in the search bar. Check out a few of the top posts. Take into account the number of pins, the design, and the relevance of the information presented. Similar to visual.ly, save the URLs of the ones you liked in case you need them for reference later.
Visit Ahref and look up infographics about your niche. Sort the results by “referring domain” to find the ones with the most backlinks. You can filter the results further as per your preference and take inspiration from some of the top posts.
Once you have taken a look through some of the popular infographics found through some of the best SEO tools and design resources, you will have an understanding of what topic you want to present and how do want to design it.
If you want to use data from those infographics, make sure to verify if they are correct or not. If they are a few years old, keep an eye out for updated data and use that for your one.
Keep all the saved URLs of the posts you would want to use as references in a spreadsheet. It will help you create an outreach list when you get to the link-building process.
Now that you have a solid idea of which direction to go, you have to determine what target audience would be most interested in it. If you have a specific topic with a certain audience in mind, then your audience should be highly specific and would be willing to share your infographic around.
If you have selected a more trending topic, you can aim for a more general audience.
It is important to understand what audience would be interested in your topic. That way, you will be able to set a theme and tone which is appropriate for them. If your target is middle-aged businessmen, a quirky and fun tone may not be a suitable tone to go with.
Once your information and audience are set, it’s time to set on a narrative that will engage the viewers with what you are presenting.
Infographics are a form of visual storytelling. If you just stick a bunch of statistics, numbers, and facts on a page, it will not be good at capturing the attention of the audience. You will need to construct a flow and structure to let the information tell a story. Have a starting point and a conclusion.
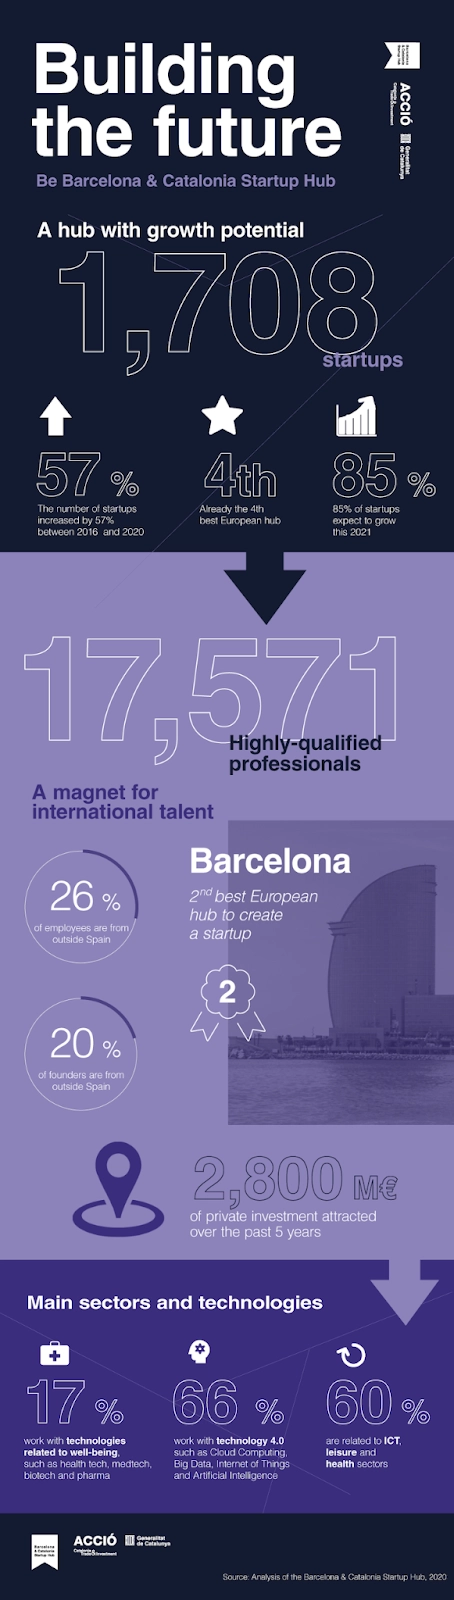
Take a look at the following infographic by Accio, which highlights the business growth potential of Barcelona and Catalonia for startup hubs. You can say the narrative sold here is that these two regions are great for having a startup. So how do they present to you that information?
First, it paints a picture of the current situation. It shows you how many startups are presently operating along with a lot of current standing.
Next, it guides your attention to the potential local and foreign talent available over there. Finally, it showcases the active sectors.
Through the use of clever imagery and cleverly placed arrows, it can guide you through all its necessary information without overwhelming you. Not to mention, the tasteful color scheme it uses to make the whole thing easy on the eyes.
Strive to make your one a complete narrative experience for your reader. Take inspiration from examples such as this.
Once you have decided on the content and narrative aspect, it is time to decide on the best layout that would do your infographic justice. We have already discussed the different types of ways you can arrange your information. All of them have specific uses that are most suited to the content.
Decide on a format that will present your audience with your information in the easiest and most eye-catching way.
Finally, once everything has been decided, it is time to finally get to designing. There are a few ways you can go about it. We have provided some ways that may be suitable for you.
Canva is a commonly used designing tool used for a variety of purposes, including an infographic. It is easy to use and it provides a lot of free templates that may be suitable for your needs.
If you believe that you have the designing abilities for the job, you can try your hand at it with Canva.
Piktochart is another beginner-friendly free design tool that is more specialized in infographics than Canva. The downside is that there are fewer free templates available here than Canva. Nevertheless, it’s worth trying out and one of the free templates might just be what you need.
It is to be noted that you should try out all the free stuff before you decide on going premium on these sites.
If you do not want to design the infographic yourself, you can hire a freelance designer to do it for you. You can look up freelance designers from sites such as Upwork or Fiverr who would be willing to work for you. Sites like those have a lot of criteria for searches that will help you find your ideal designer.
Once you are done with the design, you have to finalize the title. Keep in mind the following
Try to come up with a few titles and select the one you think will be best for you.
Now that your infographic is ready, it is time to start the link-building process.
First of all, you will need to publish the thing for other websites and bloggers to backlink to you. Create a new page or a blog post on your website to host it.
Do not just post the infographic by itself. While it will be the main attraction that will bring in new visitors through backlinks from other places, you will need to add some sort of text that describes or narrates it.
As much as Google likes saying that word counts do not matter, you can see that longer posts with more text rank higher in SEO. It is quite evident that Google likes some sort of text accompanied by the main image posts.
A good tactic is to post it with some text explaining the thought process and findings alongside an embed code to make it easier for visitors to share your website around.
Another good practice is to end the page with a Call-To-Action (CTA), asking readers to share it with their sites. There is no downside to this and you may get a few more shares without too much effort.
Before you start reaching out to prospects for link building, it would be ideal to increase your infographic online presence first to increase your chances of getting more organic backlinks.
You should already have an idea of who your audience is by this point. Try to find out where the presence of your target audience would be the most. Nowadays, most people are on one form of social media or another.
Make a page for yourself where you believe your target audience might be. Do not post the whole infographic by itself initially. Tease bits and pieces of interesting information that might entice your audience to check out the whole thing on your website.
You can even tease your audience as you are in the creation process. Post the parts of the unfinished product and build anticipation among the audience toward the findings or conclusions you may arrive at.
This way, you will have an online presence even before you even finish the whole thing. If you build enough anticipation, you will find a steady growth of traffic when you finally publish it.
If you find social media to be a promising place for backlinks, you can utilize paid ads on those sites to boost your visibility.
Also, make sure you are sharing your website to places where your topic is related. You can search for forums discussing topics where sharing your page will provide value.
Reddit is one of the more popular forum discussion sites and being able to search your niche by subreddits will help you find opportunities to share around your thing.
Once you have set yourself up for organic backlinking, it is time to get into link-building by reaching out to potential prospects.
Manually looking for websites willing to backlink to you is not an effective tactic. Utilize tools like Moz, Semrush, or Ahrefs site explorer to find relevant pages that will link back to you.
You can even try Respona, which allows you to use the three mentioned site explorers under one page.
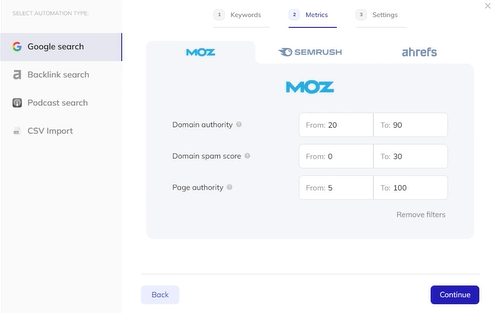
You can look up websites with specified keywords to find relevant websites for you. While there are some variables between the three, you cannot go wrong using any one of them. All of them will let you find websites with specified Domain Ratings (DR) and URL Ratings (UR).
Here, put the related keywords of your infographic topic into the search bar to find similar websites about your topic and see what websites they got backlinks from. That will be your prospects.
Domain ratings are an “authoritative” rating of websites while URL ratings are an “authoritative” rating of a specified page of a website. The higher the rating, the better quality of backlinks you will receive. The ratings themselves are done on a scale of 0-100.
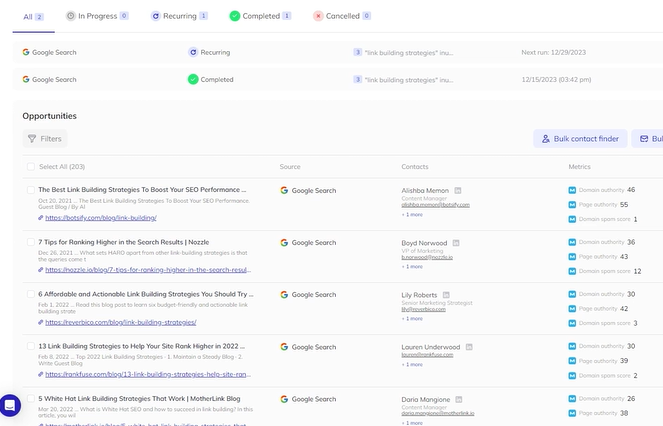
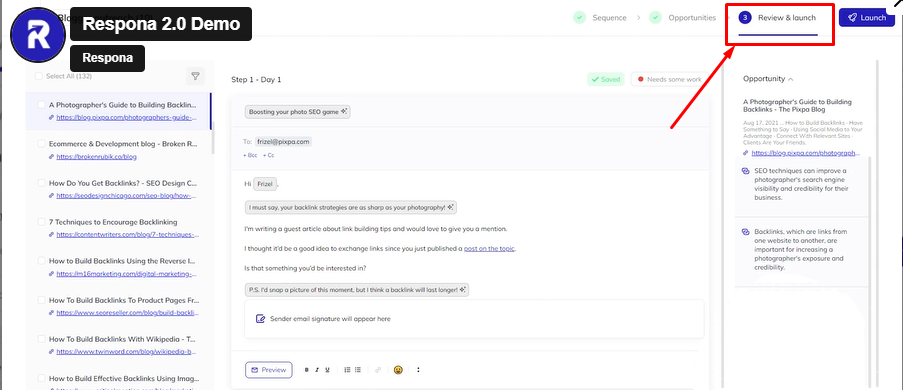
Now that you have a lot of prospective websites, compile a list of emails to contact. Most websites will let you know of to contact them. Respona lets you send emails directly through their site through the review and launch button.
If you are using Ahref or any of the other site explorers, make sure to turn their “one page per domain” filter on.
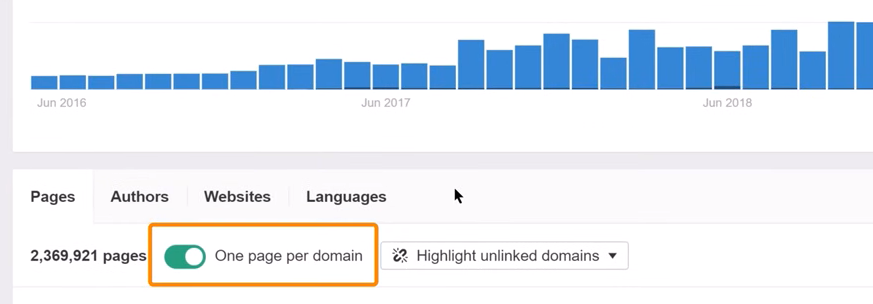
Export the results to get a list of domains you will be pitching to.
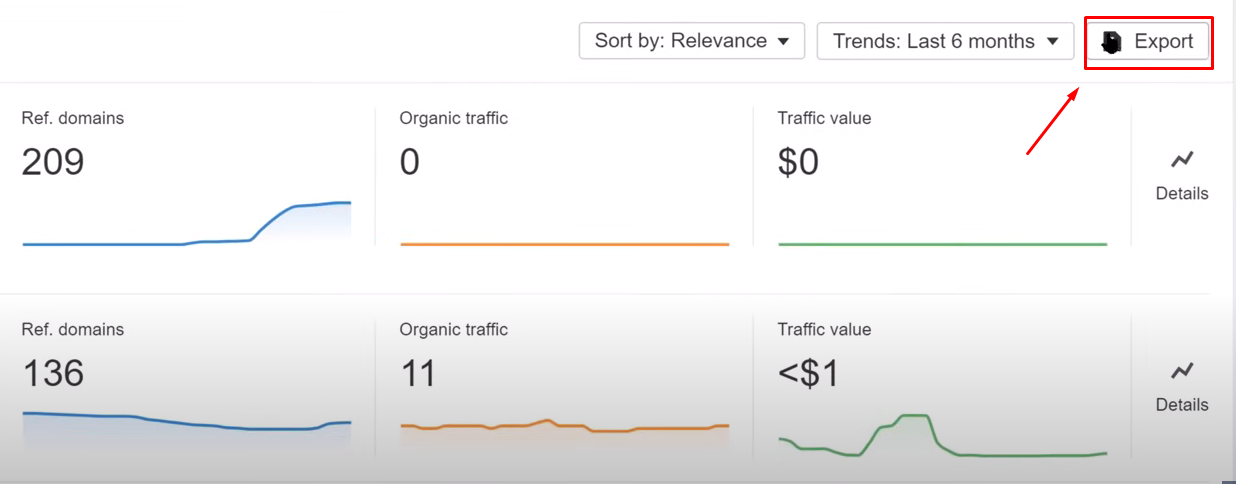
Now, collect the emails of the domain owners and you will have a list of prospective contacts.
Now, just like making a sale, you will need to pitch a proposal to the owner of the website and convince them to backlink to your website. Now, there are three main aspects to keep in mind if you want a successful pitch.
Try to meet each of these criteria with your pitch. Websites will be more than willing to backlink to you if it is mutually beneficial.
You can choose to use an outreach tool for this. Respona has integrated outreach tools with integrated AI tools to make the pitch for you. Do not blindly use AI tools to write your emails and try to modify them to give them a more human touch.
You can also choose between Pitchbox or Buzzstream for this.
Here are some tips you may follow to increase your chances of getting a response.
There are a lot of directories where you can publish your infographic. Most directories will usually accept your one but sometimes you may need to accompany it with a unique description.
This is a great way to get a backlink to your website and help you get in front of a wider audience.
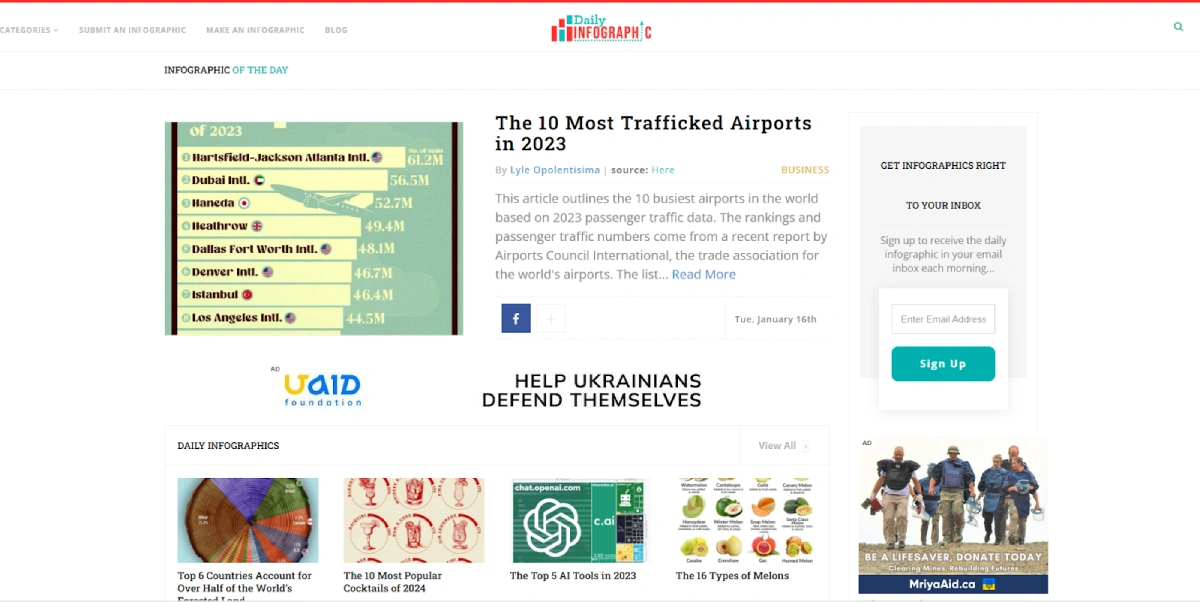
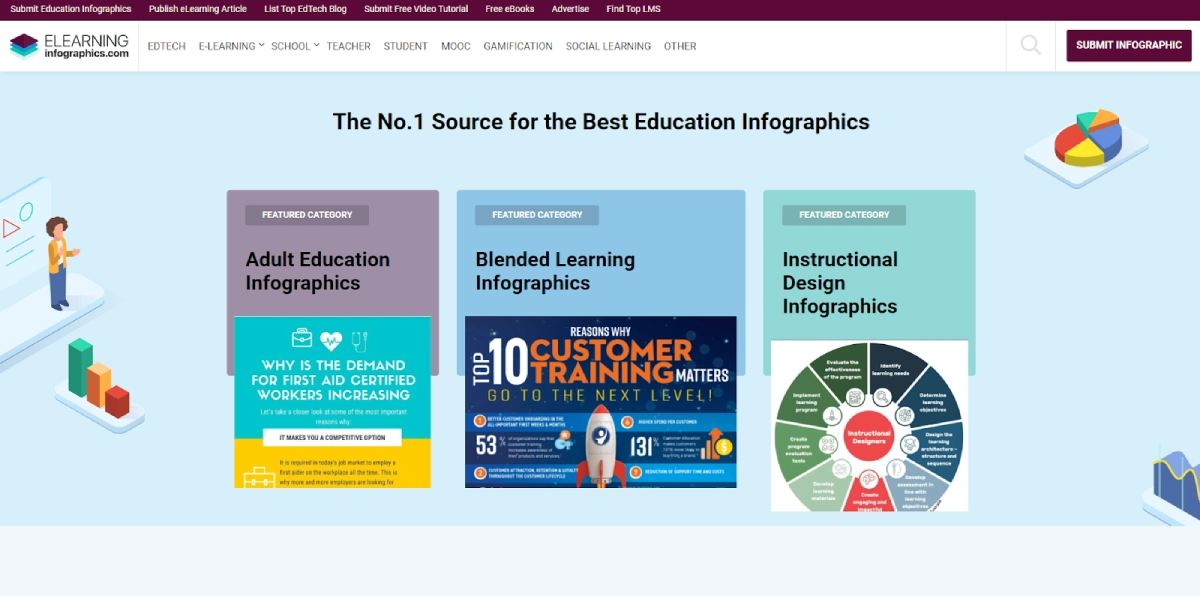
Behance, Daily Infographics, and e-Learning Infographics are great directories where you can share your infographics.
Infographics are a great way to take your link-building campaigns from average to extraordinary. Other sites will usually give you a backlink if your content assets are worth sharing.
This is why it’s important that you present a unique and high-quality infographic. These are the two most critical elements to getting quality backlinks in this method.
Using infographics to build links is a tried and true strategy, and we hope you will be able to follow our guide and successfully bring in the traffic that you deserve.
Q. Can I put links in my infographics?
Ans. Yes, you can do that without any issues. When designing infographics, you can add your URLs to specific text or elements like buttons or icons. Just make sure they are clearly visible and distinguishable from other text or elements.

Don’t miss out on the latest trends and info on SEO, search engines, social media, and more.

Need help with your link building campaign? From consultation to strategy to implementation to reporting, our professional help is awaiting you!